
near-real-time printer performance metrics now available at both printer and job level
previously undetected printer downtime patterns identified and addressed through operational dashboards
IoT sensor data combined with process control system data into a single operational reporting platform
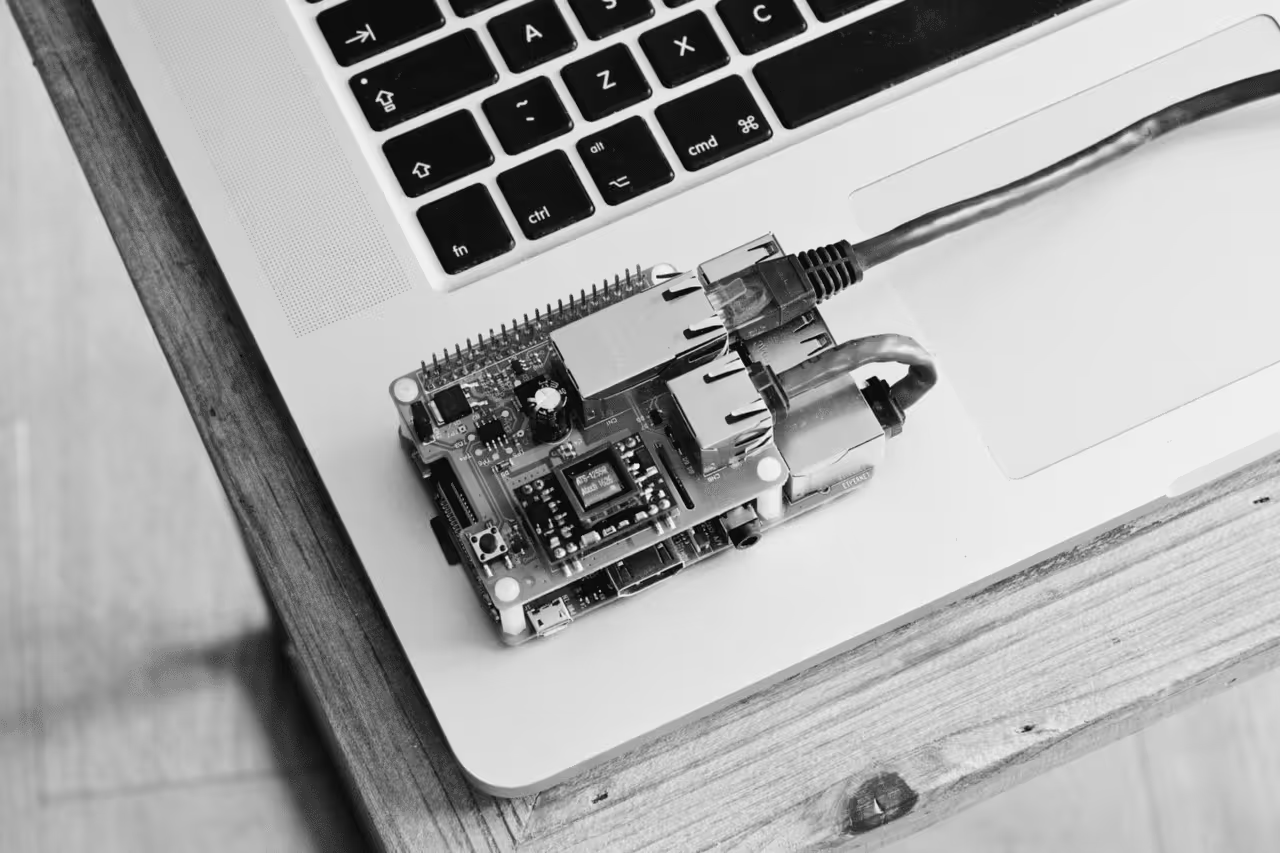
The Internet of Things (IoT) holds tremendous potential in virtually every industry and market. The IoT introduces network-enabled devices and sensors that can collect data at a large scale and produce valuable insights. The question remains for many businesses: What do they do once they have that data?
One of our clients in the commercial printing space recently grappled with this very question. It installed “electronic eye” sensors on many of its industrial printers, but struggled to convert captured data into actionable reporting that drove strategic decision-making. OneSix was brought in to help build a data warehouse solution that could facilitate operations reporting using data gathered through IoT-enabled sensors.
Our team took a process-focused approach with this project, building new processes for intake, compression, and integration of data captured by the industrial printer sensors. In addition, we combined that data with the work activity data produced by our client’s process control system.
One of the major goals of the project was to improve visibility into printing operations at a very granular level. To that end, OneSix worked alongside the company’s process engineers to develop printer-centric and job-centric views that accurately reported on the efficiency of printing operations. We also developed a web service that provides printer performance metrics with near-real-time reporting.
Since implementing OneSix’s data warehouse platform, our client has gained more visibility into its printer operations, including recognizing printer downtime patterns that would have otherwise gone unnoticed.
More to explore

OneSix built an AI-powered lead generation engine that surfaces high-propensity buyers from third-party signals and unstructured data, replacing manual, rules-based prospecting with prioritized accounts the sales team can act on.

OneSix developed an AI-powered platform for a leading automotive company, enabling real-time parcel tracking and smart shelving to enhance delivery efficiency and streamline driver workflows.

OneSix built a custom data platform that converts unstructured student conversations into multi-dimensional personas and predicts enrollment outcomes.